
Debug Swift Package Manager projects using dap-debug
April 26, 2021
Updated 2025-02-04
- updated for Xcode 16.2 (still using LLVM release 17.0.6)
- added libzstd dependency
- added Python 3.12 requirement and instructions
Updated 2024-07-14
- updated for LLVM release 17.0.6 and Xcode 15.4
- changes name of extensions directory to
lldb-dapin preparation for upcoming LLVM 18 changes - updated Vapor build artifact name from
RuntoApp
You may know you can edit and build your Swift PM projects outside of Xcode, but what about visual debugging? The Debugger Adapter Protocol (DAP), a gift to the world from the VSCode project, allows us to hook up our editor of choice (not just VSCode) to LLDB to visually debug Swift code.
This walk-through demonstrates how to set up Emacs dap-mode for Swift debugging1 and debug the Vapor Hello World example project.
Bad News First
You still need to do this on a Mac with Xcode installed. Theoretically this process should work on any machine that can build the llvm-project but right now, without the LLDB.framework that ships with Xcode, you’ll be unable to inspect variables at stopped breakpoints.
This is a pretty big deal for me but I’m hoping that whatever magic sauce is in the Xcode-packaged LLDB.framework makes its way up to the mainline llvm-project eventually2.
Then what’s the point
If you still need a Mac and Xcode, then why not just use Xcode? Excellent question. This process at least gives you the choice of what editor to use, and enables the full development cycle outside of Xcode.
Process overview
In this post we’re going to:
- install and configure dap-mode in Emacs.
- clone and build the llvm-project from source.
- hack the lldb-vscode extension produced in our build to work with the LLDB.framework that comes with Xcode.
- install Vapor and build the Vapor Hello World example project.
- set a breakpoint in the
routes.swiftfile of the Hello World project and confirm that we can run, break, and see the call stack and local variables.
Phew. Let’s get started.
Install and Configure dap-mode
I’m going to assume you already have lsp-mode installed. Make sure you have (require 'lsp-mode) and
(require 'lsp-ui) somewhere in your Emacs config.
For dap-mode, follow the steps on the dap-mode Github README. I keep it pretty simple with:
(require 'dap-lldb)
(dap-auto-configure-mode)
dap-mode uses debug templates. You’ll eventually want to add one for every target you debug. For now, add this to your config for our Hello World example.
(dap-register-debug-template "Vapor Hello World SwiftPM"
  (list :type "lldb-vscode"
        :cwd "/come/back/and/fill/this/in/later"
        :request "launch"
        :program "/come/back/and/fill/this/in/later/App"
        :name "App"))
Don’t worry about the missing paths for now… we’ll come back and, well you get the idea.
Install the build system
You’ll need CMake and the Ninja build system installed, as well as the zstd compression library.
brew install cmake ninja zstd
Downgrade to Python 3.12
You can check your currently installed Python version with:
python3 --version
If it’s more recent than 3.12, you’ll need to downgrade in order to build the version of LLVM this procedure depends on (otherwise you’ll see an error related to _Py_IsFinalizing. Here’s what I did when I saw I had Python 3.13 installed:
brew uninstall --ignore-dependencies python3
brew reinstall python@3.12
ln -s /opt/homebrew/Cellar/python@3.12/3.12.8/bin/python3.12 /opt/homebrew/bin/python3
Now a version check should show you 3.12.8 (or similar).
Important: if you’re on an Apple Silicon mac but still have a homebrew-installed Python for the Intel architecture (in the /usr/local/bin directory) you’ll want to uninstall it as well, as the LLVM build seems to prefer the x86_64 libraries over the arm64 ones and you may get linker errors during the build.
Clone and Build the llvm-project from source
Open your terminal, make yourself a slow-sipping beverage, and type:
git clone https://github.com/llvm/llvm-project
cd llvm-project
git checkout llvmorg-17.0.6
As of this writing LLVM has released 18.0 and later, but versions of LLDB.framework past 17.0.6 didn’t work for me (lldb-vscode crashes with a error caused by a function removed from version 18+). I suggest sticking with 17.0.6 for now, or check the current release to decide for yourself.
This next step is pretty weird but here we are. You need to completely remove the Xcode command-line tools in order to prevent build errors for llvm-project. We’ll be reinstalling them shortly, but for now quit Xcode if it’s running and, in terminal, type:
sudo xcode-select -s /Applications/Xcode.app
sudo rm -rf /Library/Developer/CommandLineTools
Ok let’s build llvm-project. If you’re not on Apple Silicon skip the line with CMAKE_OS_ARCHITECTURES='arm64'.
rm -rf build
mkdir build
cd build
cmake -G Ninja \
  -DLLVM_ENABLE_PROJECTS="clang;clang-tools-extra;lldb" \
  -DCMAKE_OSX_ARCHITECTURES='arm64' \
  -DCMAKE_C_COMPILER=`which clang` \
  -DCMAKE_CXX_COMPILER=`which clang++` \
  -DCMAKE_BUILD_TYPE=Release \
  -DLLDB_INCLUDE_TESTS=OFF \
  -DLLDB_BUILD_FRAMEWORK=ON \
  -DDEFAULT_SYSROOT="$(xcrun --show-sdk-path)" \
  ../llvm

cmake --build . -- -j8
Remember that drink? This is where you get to sip it as you watch llvm build. No rush. If you run into build errors related to Python or SWIG, check to make sure that your Python has not updated to 3.13 yet and that you don’t have a version of Intel python installed on an Apple Silicon mac.
Reinstall Xcode command-line tools
Assuming that the build succeeded:
sudo xcode-select --install
Copy the built lldb-vscode extension
Part of the llvm-project that we built was the lldb-vscode extension. We need to copy the binary into a place where dap-mode will find it:
mkdir -p ~/.vscode/extensions/llvm-org.lldb-dap/bin
cp ../lldb/tools/lldb-vscode/package.json ~/.vscode/extensions/llvm-org.lldb-dap
cp bin/lldb-vscode ~/.vscode/extensions/llvm-org.lldb-dap/bin
Hack the rpath of the extension
The rpath of the lldb-vscode extension we just built points directly into the bin directory of llvm-project tree, which is where it’s going to look for LLDB.framework. You can confirm that by typing:
cd ~/.vscode/extensions/llvm-org.lldb-dap/bin
otool -l lldb-vscode
Look for the LC_RPATH entry. We need to change it, because we actually want lldb-vscode to use the LLDB.framework from your currently installed Xcode (16.2 at the time of this writing). The LLDB.framework we just built as part of llvm-project won’t fully work: you won’t be able to see locals or a stack trace during Swift debugging, which makes it less useful.
Here’s how to replace the rpath. You’ll have to plug in the current rpath from the otool command above.
cd ~/.vscode/extensions/llvm-org.lldb-dap/bin
install_name_tool -delete_rpath /exact/rpath/from/the/otool/command/you/just/issued lldb-vscode
install_name_tool -add_rpath /Applications/Xcode.app/Contents/SharedFrameworks lldb-vscode
Check again with otool -l lldb-vscode. There should be only one LC_RPATH, and it should point to /Applications/Xcode.app/Contents/SharedFrameworks.
Install and Build Vapor Hello World
You can try this with any Swift PM project of course but Vapor’s Hello World is a perfect example. Change into your Documents/Projects/Scribbling directory (mine is /Users/gene/Proj).
Install Vapor with:
brew tap vapor/tap
brew install vapor/tap/vapor
vapor --help
If that worked you’ll see a list of available vapor commands. Ok let’s create the Hello World app.
vapor new Hello
cd Hello
swift build
find . -name App
That last command will show you where the Run binary got dropped. Make a note of the full path to the file … on my machine it’s /Users/gene/Proj/Hello/.build/arm64-apple-macosx/debug/App.
Go back to your Emacs config and modify the debug template with the correct working directory and program to run. Mine is:
(setq dap-lldb-debug-program `(,(expand-file-name "~/.vscode/extensions/llvm-org.lldb-dap/bin/lldb-vscode")))

(dap-register-debug-template "Vapor Hello World SwiftPM"
  (list :type "lldb-vscode"
        :cwd "/Users/gene/Proj/Hello/.build/arm64-apple-macosx/debug"
        :request "launch"
        :program "/Users/gene/Proj/Hello/.build/arm64-apple-macosx/debug/App"
        :name "App"))
Reload your Emacs config.
Set a breakpoint and see if it hits
Start debugging with M-x dap-debug. Select the template you just added: that should launch the Vapor web server and the Hello World app.
In Emacs, find Sources/App/routes.swift in the Hello World project. Move the point to the line that says return "It works!" (line 5 for me). Issue M-x dap-breakpoint-add. You should see a breakpoint indicator dot appear to the left of the line.
Open a web browser and navigate to http://127.0.0.1:8080. Your breakpoint should hit and you’ll see something like this.
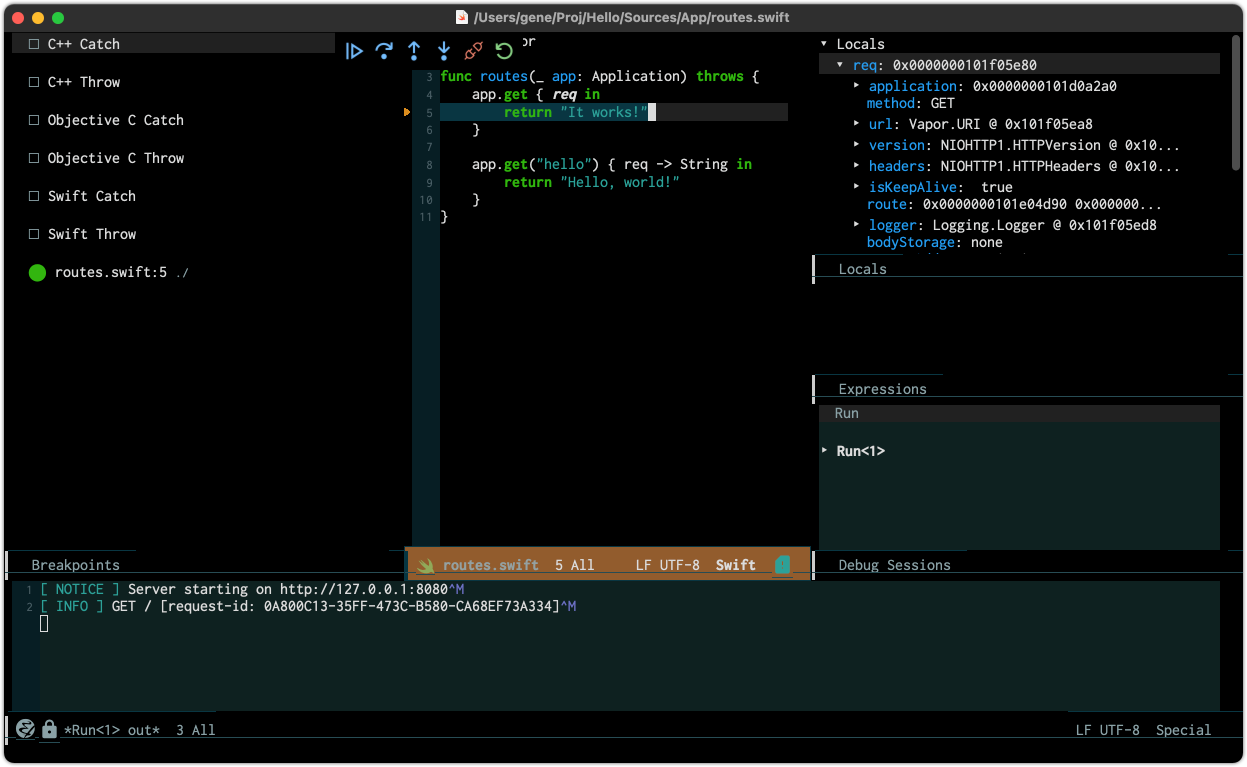
Figure 1: Breakpoint hit
Under Locals (top-right on my screen), if you click on req it will expand and show you the Vapor request properties at the time your breakpoint was hit. If you don’t see req at all, something went wrong and lldb-dap isn’t using an LLDB.framework that can show locals. My only recommendation is to try this procedure again to see if you missed anything. It’s also possible that this functionality will regress again in the future (like it did in LLVM 11.0.1 / Xcode 12.4) so join me in keeping our fingers crossed.
The stack trace is available by clicking the Run label in the Debug Sessions pane. To stop debugging issue M-x dap-disconnect. I’ll leave further investigation to you, and I may also expand on this in future blog posts.
Congratulations on making it this far, and on getting it to work. My hope is that the LLVM and DAP story will continue to expand and improve in the future, possibly dropping the dependency on Xcode entirely.
Footnotes:
I am not familiar with the VSCode extensions ecosystem but I imagine it would be even more straightforward to set up there.
At the recommendation of one of the reviewers of this post (thanks Dan!) I tried this process using Apple’s fork of the llvm-project but still could not shake the dependency on Xcode’s LLDB.framework.

I'm Gene Goykhman, software developer, entrepreneur and principal at Indigo Technologies Ltd. I work on the TimeTiger time and project tracking system and play with some tasty projects on the side. I have lots of opinions about stuff.
Have a comment? Find me on Mastodon @genegoykhman